Water shortages are more often from a lack of storage capacity (in snow or reservoirs) than from lack of precipitation each year. About 85% of the water we extract here is used for irrigation. Although a certain portion of over-irrigation seeps down into aquifers, most of the water is pumped back into the atmosphere through evapotranspiration by plants. From there, it travels East, to fall somewhere in the interior rainforest of the Kootenays, leaving the Okanagan dry.
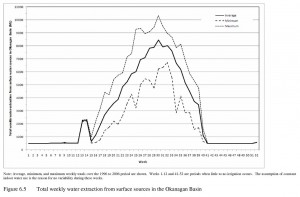
This mountainous peak is Okanagan summer water use. The flat shoulders represent the low levels of winter residential and industrial water use.
Because of the huge irrigation needs, the vast majority of our water use is in July-September. The amount we use depends on the weather: between 1996 and 2006, total water use ranged from about 187,000 ML in 1997 (a relatively wet year) to 247,000 ML in 2003 (an extremely dry year). In dry years, when less natural precipitation happens, we need much more irrigation.
There is uncertainty about the effects of global warming, but strong consensus on the general trends for water. Our recently-completed Okanagan Basin Water Supply and Demand Project found that, similar to many areas, our winters are likely to become shorter and warmer (on average), with less snow and more rain.
Paradoxically, a winter with above average precipitation (in the form of rain) could be the precursor to a summer of water shortages. This is where snow storage comes in. Slowly melting snow recharges groundwater, keeps flows in the streams for fish, and trickles down into drinking water reservoirs, delaying their draw-down in the hot summer irrigation season.
Our water systems are designed around the idea of relatively predictable snow storage. If more of the precipitation comes as rain, we have limited capacity to hold it and excess water has to be released over the dams in the spring to reduce flood risk. Come summer, it is gone. Our water supply study found that climate change alone could cause a 49% reduction in Mission Creek summer flows by 2041-70.
The most obvious way to adjust for less predictable snow storage is to increase the number and size of reservoirs in the upper watersheds. Although these have hight engineering and infrastructure costs, if we capture and hold the rainwater, we can make up for less snow.
Right now, reservoirs make up about one third of the licensed water supplies in the valley – 133,000 out of 443,000 ML (million litres). Reservoirs have their own environmental costs, and most of the ‘easy’ sites in the Okanagan have been developed. After the recent disastrous dam failure in Oliver, it will be even more difficult and expensive to put in new reservoirs above inhabited areas. This makes existing reservoirs extremely valuable. The Okanagan Basin Water Board and local utilities have had a long-time campaign to reduce pollution from resource or recreation developments around drinking water sources.
Okanagan Lake is the largest storage reservoir in the valley, but if we hold more than full pool, roads, homes, and infrastructure will be flooded. If it is drawn down or “mined,” we risk taking it below the sill level of the dam in Penticton, leaving docks high and dry and (in an extreme case) destabilizing the floating bridge.
Another way is to slow down the rainwater as it runs off the land and direct it into wetlands or infiltration basins to refill the aquifers. This is a great practice, but mostly applies to the unconfined alluvial aquifers at the valley bottom.
A third way is to increase the efficiency of irrigation and water use in agriculture, industry and at home. Strategies range from expanding the re-use of treated wastewater – offsetting fresh water demands – to replacing ornamental turf-grass with drought-tolerant plants. 
It may seem improbable on a hot July day, but putting in drip emitters and water-wise landscaping is one way that individual Okanagan residents can adapt to less snow in the mountains in January.
We do have some things to be thankful for. Many cities around the world depend on melt-water from rapidly receding glaciers. Once the glaciers are gone, it is hard to adjust to reductions in water supply. We can also be thankful that we have the knowledge, resources, and a bit of time to adapt water systems for long-term changes. We can always be thankful for good snowfalls.


I can’t resist pointing out that Ruskin was British; virtue of necessity much, John? (I lived for a year in Cambridge. Foulest weather I’ve ever lived with – almost incessantly gloomy, chill, and damp.)
Pingback: Water leadership in changing times: trials and innovations | Building Bridges
The January 1st, 2012 snow survey is now complete. Data from 99 snow courses and 51 snow pillows around the province and out-of-province sampling locations, and climate data from Environment Canada, have been used to form the basis for the following reports.
The full version of the bulletin including text, data, graphs and basin index map can be viewed at the River Forecast Centre web site: http://bcrfc.env.gov.bc.ca/bulletins/watersupply/current.htm
Weather
Weather across British Columbia on average was near normal for October and November. December was drier than normal and 1-3 ̊C warmer than normal across the province. However, persistent high pressure ridging, particularly in the southern portion of the province, led to a fairly distinct difference in seasonal weather between the north half and south half of the province. The combination of high pressure in the south and low pressure systems off the Gulf of Alaska created a more northerly flow to the movement of Pacific storm systems. This led to much wetter than normal conditions in the north, and drier than normal conditions in the south. The breakdown of the high pressure ridging in mid-December brought the return of a more southerly track to storm systems, and more typical seasonal weather patterns to southern British Columbia.
Snowpack
Basin snow water indices across British Columbia reflect the seasonal weather pattern of wetter conditions in the north and drier conditions in the south. Basin indices are above normal through the Upper Fraser, Nechako, Middle Fraser, North Thompson, Columbia, Skeena-Nass and Peace, with a high of 170% of normal in the Upper Fraser basin. Snow basin indices for the southern portion of the province is normal through the south and south-east (Similkameen, Kootenay) and below normal through most of the south Interior (Okanagan-Kettle, South Thompson) and south-west (Lower Fraser, South Coast, Vancouver Island). The lowest observed snow basin index is 77% of normal for the Lower Fraser.
BC Snow Basin Indices – January 1, 2012
Basin % of Normal Basin % of Normal
Upper Fraser 170% Kootenay 101%
Nechako 124% Okanagan-Kettle 72%
Middle Fraser 114% Similkameen 107%
Lower Fraser 77% South Coast 82%
North Thompson 109% Vancouver Island 88%
South Thompson 80% Peace 147%
Columbia 117% Skeena-Nass 137%
Outlook
Last year’s snow season was influenced by a strong La Niña event (cooler than normal sea surface temperatures in the equatorial Pacific Ocean), which may have contributed to higher than normal snow packs, a cool spring, and a delayed and prolonged snow melt season. La Niña conditions have re-emerged over the past few months. The Climate Prediction Centre with the U.S. National Weather Service (NOAA) is predicting a weak to moderate La Niña event to persist into the spring of this year. In combination with La Niña, cool-phase Pacific Decadal Oscillation (PDO) conditions are present in the north-west Pacific with cooler than normal temperatures in the Gulf of Alaska. In-phase La Niña and PDO conditions tend to enhance seasonal climate effects. Current seasonal weather forecasts from Environment Canada are similar to what would be expected under La Niña and cool-phase PDO conditions, with cooler than normal and normal to wetter than normal conditions throughout most of British Columbia. Temperature anomaly outlooks tend to have greater forecast skill than precipitation anomaly outlooks.
By this date, generally about one-half of the annual BC snowpack has accumulated, with another 3 or more months of accumulation still to come. At this stage the two main issues in snow pack are the below-normal snow packs in the south Interior and south-west BC (and the potential for water supply issues into the summer of 2012), and the above-normal snow packs in the Upper Fraser, Peace and Skeena-Nass regions (and potential for increased spring flood risk). The current seasonal climate outlook is favourable for the development of above-normal snow packs through most of the province. This would assist in further developing the snow pack in regions that are currently below-normal, but may exacerbate snow pack in areas that are currently above-normal. It is currently too early in the snow accumulation season to be able to predict snow pack evolution over the remainder of the season with a high degree of certainty. The development of the snow pack through January and February will give a clearer picture on how these potential concerns evolve.
The next snow bulletin, for the month of January, will be available on or after February 7, 2012.
Produced by: BC River Forecast Centre
January 9, 2012
Pingback: Water and the Future | Building Bridges