How do I access data?
There are two levels of data access in the Okanagan Basin Water Quality Database (OBWQDB):
- Public Data: Click the “Click Here for Public Data” button. Wait for the data to load and then interact with the map to select the site you are interested in.
- Private Data: Enter your organizational access code. Wait for the data to load and then interact with the map to select the site you are interested in.
Please find answers to Frequently Asked Questions below.
Viewing Data:
Do I need an account or code to access Public Data?
No account or code is required. You can access Public Data by clicking the “Click Here for Public Data” button. Wait for the data to load and then interact with the map to select the site you are interested in.
I’m only seeing Chemistry data – how can I view Algae data?
Click on the tabs at the top of the page to switch between Chemistry & Algae.
I was doing nothing and the page went gray
The application has a built in timeout feature to prevent excessive server use and will go to sleep after 15 minutes of inactivity. Refresh the page and resume working.
What do the different coloured circles mean on the map?
Different coloured sample location icons are used to differentiate different types of locations.
| Site Type | Icon Colour |
| Creek | blue |
| Reservoir | yellow |
| Tailings Pond | red |
| Seepage | green |
| Natural Lake | purple |
| Groundwater | pink |
| Effluent | cyan |
| Pit Lake | orange |
| Beach | brown |
| Infrastructure | black |
How are you handling non-detect values?
Water chemistry data routinely contains non-detect values. These values vary depending on the parameter and lab analysis performed. The data stored in the database contains all available non-detect information but this is adjusted before being displayed in the OBWQDB application. We have chosen the standard practice of converting the non-detect values to 1/2 of the detection limit.
The detection limit is derived from the data in the database and some parameters are regularly above the relevant detection limits. In these cases, it may appear that there is no detection limit or as NA in tables. If this occurs, it means that all data for the site and parameter in question was above all detection limits over time.
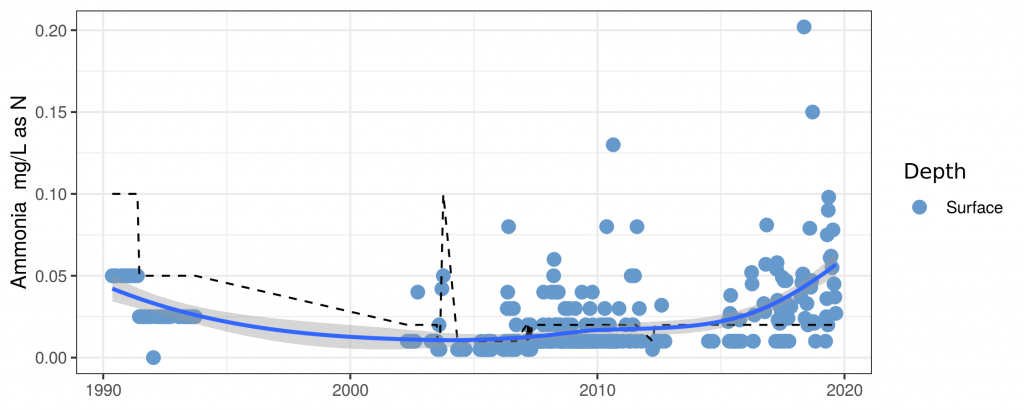
The detection limit can be seen on data using the “Scatterplot” visualization option as a dashed black line. If the dashed line is not visible, this means that the data for the given parameter at that site has always been above the detection limit.
Over time lab detection limits have become much more sensitive and so in a large database such as the OBWQDB, several detection limits may exist for the same parameter and site depending on the time the sample was collected. In these cases, the detection limit line will appear to change (see figure below).
What calculation are you using for the trends?
Trends are calculated using the Mann-Kendall non-parametric trend test. We assume a level of significance of p<0.05. The p level is always displayed next to trend calculations. The Mann-Kendall trend test is useful for water data because these data are rarely normally distributed and therefore standard parametric trend tests such as least-squares regression are not appropriate. We have chosen to apply the trend directly to the data instead of performing additional data normalization approaches. If you wish to use other statistical tests, use the data export tab to export the raw data.
Can I export the data?
Yes, the raw data can be exported in MS Excel format.
Comparing Data to Guidelines:
How do I use the Guidelines Comparison Tab?
The guidelines comparison tab is a powerful set of tools to allow you to compare any set of water quality data against various water quality guidelines. It gives context to the raw data and tells you how the data compares against health guidelines. It is important to remember that a guideline does not exist for every parameter and not all guideline options will have a guideline value for the same parameter.
What is an Exceedance?
An exceedance is the amount by which a parameter exceeds a guideline or standard.
What are the Guidelines and what do they mean?
CDWG
Canadian Drinking Water Guidelines
These are the national guidelines that are applied to domestic drinking water and focus exclusively on human health. More info (external link)
BC.Aquatic.Life.Guideline.MAC
British Columbia Ministry of Environment Maximum Allowable Concentration (MAC) for the protection of aquatic life
These are provincial guidelines set by the BC Ministry of Environment. They are designed to mark the maximum allowable concentration for a given parameter with respect to the health of aquatic organisms. A MAC is applicable to any sample as it refers to the instantaneous concentration. More info (external link)
CCME.Short.Term
CCME.Long.Term
Canadian Council of Ministers of the Environment (CCME) guidelines for the protection of aquatic life
CCME is a federal body that establishes water quality guidelines for various purposes. Some provinces use these guidelines directly. More info (external link).
- The short term guideline is synonymous with the BC MAC and refers to the instantaneous maximum concentration above which one could expect to see negative impacts to aquatic life.
- The long term guideline is synonymous with the BC 30-day and refers to the chronic baseline concentration above which one could expect to see negative impacts to aquatic life that are continuously inhabiting that water.
British Columbia regulations regarding the protection of aquatic life and drinking water at contaminated sites:
Under the Environmental Management Act, The British Columbia Government established a series of water quality guidelines that are exclusively applicable to contaminated sites. These guidelines do not apply to most of the data in the OBWQDB. More info (external link)
How does the Graph work?
The graph displays a scatterplot of the data and can be edited using the same sliders as the other graphs (date, y-axis). The points in the graph are colour coded based on how they relate to the selected guideline. A gray point is a value that did not exceed the guideline while a red point is a value above the guideline. It is also possible to add the guideline to the graph as a dashed line (see figure below) but doing so will force the y-axis preventing use of the Y-Axis Range slider. As with all graphs it can be exported as a high resolution .png file and points may be clicked for additional information.
I clicked Add Guideline to the plot but I do not see it
First check if there are exceedances. If there are no exceedances, a guideline may not exist for this parameter. The graph also displays the lab reportable detection limit as a dashed black line. Occasionally, the lab detection limit and the guideline are very close relative to the scale of the graph and it can be difficult to distinguish them visually.
What else is on the page?
There is a summary box above the graph that displays the total number of exceedances for the selected parameter within the date range chosen.
Below the graph is a table with detailed information of all exceedances in the graph including the guideline value. This is useful because many guidelines are calculated values than may not be clear from the graph.
Viewing Private Data:
Do I need to enter my Access Code again, when I switch between Chemistry and Algae?
Yes. The same access code is used for both Chemistry and Algae, but must be entered separately.
I entered my Access Code and the page went gray
This occurs if you entered an incorrect access code, typically as a typo. Please refresh the page and try again.
Viewing Other Water Supplier Data:
How can I view other water supplier data?
If your organization has joined the water supplier data sharing agreement, click “Yes” on the “View other water supplier data” button to view all data shared in this group, in addition to your own private data. Water supplier group data access is limited only to those organizations that have entered into the data sharing agreement. Please contact Jamie Self to join the data sharing agreement.
How do I know who owns or contributed a given set of data?
All data is attributed to the appropriate owner at the bottom of the page.