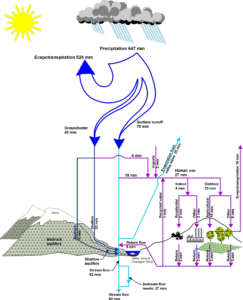
The overall annual water balance for the Basin, derived from information presented in several sections of the report, is shown in Figure 1 (click to enlarge).
The values on the figure are annual totals, but they are averaged over time for the period 1996-2006, and across the entire area of the Basin.
The figure does not indicate the variability which characterizes both water supply and demand.
Decision-making must consider the seasonal variability in both supply and demand, the differences that exist from place to place within the Basin, and the annual variability of both supply and demand.
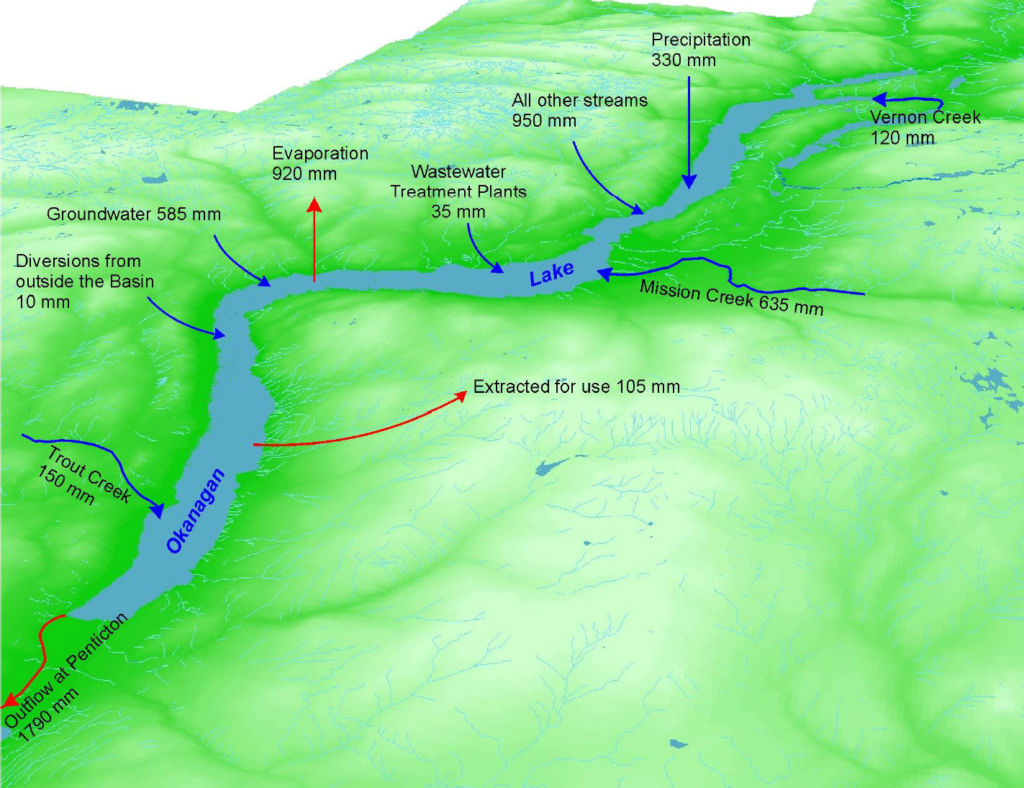
The annual average water balance for Okanagan Lake is shown in Figure 2.

Variability of supply is illustrated by annual net inflow volume into Okanagan Lake (1921-2004)


